Last month week I met a pair of co-founders ready to launch an e-commerce startup. They were getting all their ducks lined up for the launch, but were struggling with the marketing side of things. To make things more complicated, someone handed them a list of emails from a database of potential customers. They also had issues figuring out where visitors and spikes of traffic were coming from, as they didn’t have a reliable way of measuring it.
I ended up taking them through some key metrics that should be measured to get a better idea of where to focus their time, money, and energy. Here’s a list that will get you started if you’re having the same problems figuring out what’s working, what isn’t, and where visitors are dropping off.
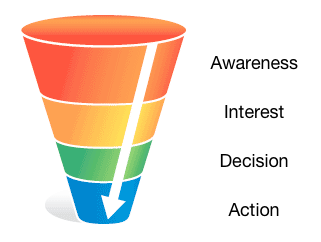
The Funnel (In Concept)
Whether it’s dating or deciding what cocktail to drink at the bar, everything has a sales funnel. For an e-commerce store, it starts from awareness – a friend’s suggestion, Google search, or display ad. From there folks move down and eventually make it to your checkout page. A large majority probably never end up here since the average conversion rate is 1-2%, and anything higher than that is great.

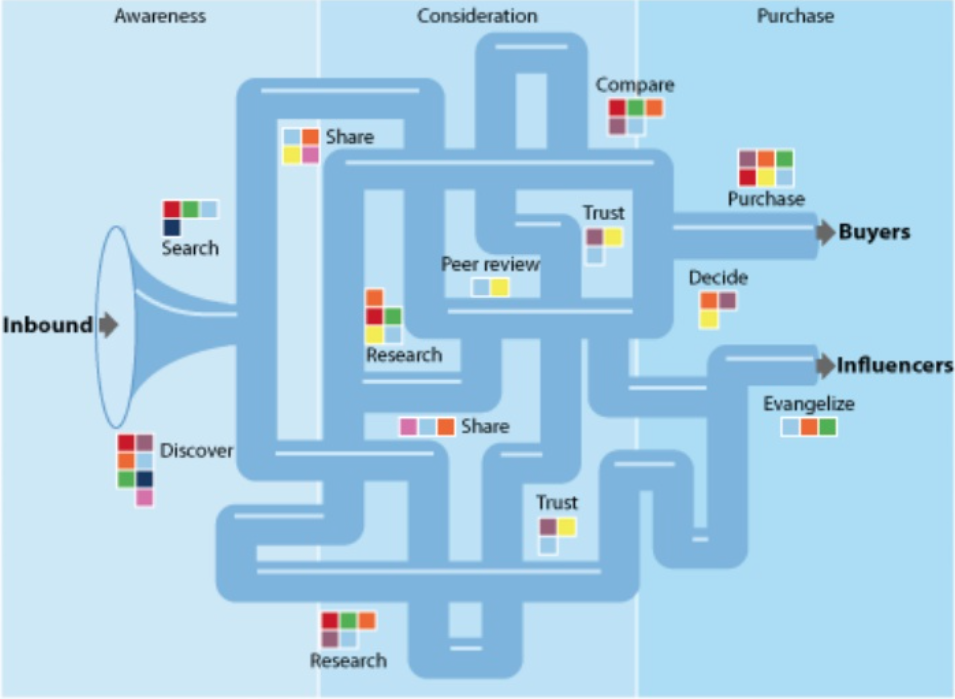
The Funnel (In Reality)
When it comes to IRL, people never move directly from the top to bottom in one motion. Sometimes they get distracted by Youtube videos, forget about you, only to be reminded again when someone mentions you at dinner.
You can’t spam folks telling them to buy your product all the time since you’ll just be ignored. You have to give first before you can ask. Interesting, useful, and high quality content (a.k.a. inbound marketing) is now a big part of this game. It’s the gateway drug that keeps you relevant in the customer’s mind. It’s why Red Bull is involved in the music, sports, and entertainment business even though they only sell sugar water.
You cannot wait until the customer is ready to buy to start engaging – it will already too late!
So What’s Going On In The Funnel?
Awareness: People are finding you in search engines, hearing about you from friends, or clicked a display ad. Visitors to your website come in three flavors – paid, earned, and owned. Do you know which one brings you the best customers? If no, you need to measure it in order to optimize every campaign and know the ROI.
Interest: Visitors start interacting with your site at this stage. Are they choosing to stay or leave? Do they join your email list? (If you need help with that, click here). The goal is to find out where the attention is spent, so that you can keep them on-site and move them into the next stage.
Consideration: Visitors are thinking about what it’s like to buy from you. They’re looking at product categories, product pages, shipping policies, guarantees, FAQs, contact pages, trust signals, and more. Your goal is to remove all purchasing friction so they take out their credit cards (or PayPal acocunt).
Action: Here’s where people are completing or abandoning checkout. For those that end up buying, you have a great opportunity to delight with the post-purchase experience so that they tell a friend, leave a review, or come back to buy again at later. Your goals at this stage are to recover abandoned carts, foster loyalty, and get reviews/referrals.
Measuring The Funnel
Now that you know how each stage works and where it corresponds with your store, we’ll go deeper into the metrics so that you know which area needs improvement.
Awareness
When people say social media or content marketing has no ROI, it usually breaks down into a couple of reasons:
- Low Quality Content. If you’re getting no interactions (views, comments, like, shares, retweets, etc) over 3 months+, chances are what you’re producing is boring, irrelevant, and adds no value. Check out what’s already working from BuzzSumo, Pinterest, or Reddit and improve upon it.
- Impatience. Most content marketing campaigns take a few months to see any momentum. If you give up two weeks in, you’re not giving it enough time to develop.
- Poor Value Proposition. For new stores it’s important to test your offering and figure out if what you’re selling is something people even want. No amount of marketing can fix a bad product/service. (Learned this the hard way!)
- No Metrics. If you don’t know your numbers you are flying blind. Is your monthly traffic increasing? Where is it coming from – direct, organic, social, referral, or outer space?
For paid traffic, it’s fairly easy to see what’s working because all ad platforms display your impressions, cost per clicks, click-through rates, and engagement. With negative keywords and the ability to turn off certain campaigns, you can quickly throw things at the wall, see what hits, and optimize from there. Blogs, videos, podcasts, and infographics all have this too – but it takes relatively much more time to measure as people discover, engage, and consume that content.

Hunter vs. Farmer
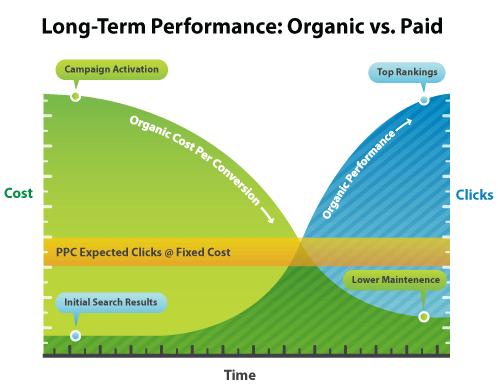
The comparison of paid ads and content marketing is like a hunter vs. farmer. A hunter always needs to go out and kill for food, much like a paid display ad campaign must always run ads for conversions. A farmer plants his seeds and hopes for a bigger harvest down the line. It’s a sacrifice in the short term for long term gains. In the end, there’s no right path to choose as it depends on various factors like your business model, budget, and more importantly lifetime value / cost of acquisition.

Organic search and content campaign take time to snowball…
Spreading your efforts everywhere does not create much marketing leverage, so focus on three channels (maximum) that are getting you the results. In the awareness stage, here are the metrics that you should measure:
Paid Traffic:
- Click-Through Rates
- Cost Per Click
- Impressions & Reach
- Negative Social Signals (Unlike, Unfollow, etc)
- Retargeting List Growth (Facebook and Google)
Organic & Search Traffic:
- Unique Visitors
- Search Rankings
- Backlinks
- Referral Traffic
- Direct Traffic
- Mentions
- Positive Social Signals (Likes, Shares, etc)
Interest
This is where visitors decide if your site is relevant to them or not. Because every source of traffic has its own context, it’s difficult to measure and compare each source apples to apples. Someone browsing Facebook is in a different mindset than someone punching your keywords into Google.
To deal with that, we beleive average pageviews is a decent metric for comparison. It’s not an exact science, but it’s the least common denominator among all channels. The logic goes that if someone is on your site visiting multiple pages, it’s safe to assume that they’re more interested than someone who visits one page and leaves. Since we can’t measure context, we’re using average pageviews to guage intent.

Not interested…talk to da hand.
On your content pages, it’s a good idea to tag folks with a Facebook remarketing cookie (See: How To Setup A Custom Facebook Audience). Even if you don’t plan on buying remarketing ads now, it’s free to build your list. When the time comes, you’ll already have a big audience that has engaged at some level with your site.
You can also start tracking heat-maps and where visitors are clicking on your site. Menu items or other assets that get no clicks should be removed as it’s just visual clutter. Email optins should also be measured as these visitors have chosen to give you their contact information. In the interest stage, here are the metrics that you should be measuring:
On-Site Behavior:
- Average Pageviews
- Bounce Rate
- Time On Site
- Landing Pages
- Exit Pages
- Heatmaps
Email:
- Opt-ins
- Unsubscribes
- Open Rates
- Click Rates
Consideration
This is where people are decideding whether or not to buy your product. Do you offer free shipping? What other options do I have? Where’s the best value? Can you be trusted? What guarantees do you have? What if I need to return it? Are you a real business? (OMG)

These are just a small number of questions that need to be addressed. The better you can empathize and handle them the less friction there is from making a purchase. If you take a minute to consider how Amazon has dealt with this friction, it’s very impressive.
With Amazon Prime you have free shipping for an entire year, great customer service, one-click checkout, hassle-free returns, and your address stored on file. Since they also discount heavily, it’s great for convenience and value. In the consideration stage here are the metrics that you should measure:
Category & Product Pages:
- Time On Site
- Average Pageviews
- Video Plays
- Heatmaps (FAQ, About Us, Shipping, Contact Us)
- Add To Cart
- Trust Signals
- Exit Pages
- Landing Pages
Action
This is where folks are taking the final steps to become a customer. They’ve come a long way from the top of the funnel at different times to discover your website, browse your content, and learn who you are. From there, a product piqued their interest and they moved further down the funnel to learn more about it. They scrolled through the images, read the descriptions, and maybe watched a video or two.
They’ve decided they want your product and added it to their cart ready for checkout. Will they get blindsided by extra taxes, handling fees, or shipping costs? These factors can make someone quickly abandon the cart. With the industry average cart abandonment rate at 60-70%, you want to avoid this by being upfront with all necessary information to avoid sticker shock at checkout.
Go through your own checkout and each payment gateway to get an idea of what it’s actually like to be a customer.

Once they’ve purchased you have a golden opportunity to delight customers with the unboxing experience. If you’ve ever owned an Apple product, you know the unboxing experience is unlike no other and very exciting. Apparently there’s some guy in California that just split tests hundreds of product boxes to get it right. In the action stage, here are the metrics that you should measure:
Shopping Cart:
- Cart Abandonment Rate & Recovery
- Average Order Size
- Conversion Rate
Post Purchase:
- Product Reviews
- Referrals
- Repeat Purchases
- Social Signals
- Return Rate
- Chargebacks
- Lifetime Value
Wrapping Up
Now you should have a very clear idea on how different elements of your site combine to form a sales funnel. By having a good grasp of the numbers in each stage and how it moves down the funnel, you’ll be able to make decisions with a higher level of confidence because everything is grounded in numbers. In case there are any metrics you track that aren’t included in here, please let us know in the comments and we’ll update the post and give you credit!


